Archives for category: Utilities

Full Source code: https://gist.github.com/956403

Problem:

You spend a lot of time and effort building your app, writing countless view controllers. You think it’s near perfect.

Then one of your beta testers (or customers, or app reviewers) finds a problem. You look into it and realize that it only happens after a low memory pressure warning.

You should have written your viewDidLoad to handle getting called after a low memory pressure warning, but you didn’t.

Wouldn’t it be great if you were forced to write your viewDidLoad implementation with low memory situations in mind? After all, out in the wild on real world devices, it’s very likely that sooner or later every single one of your view controllers will have to handle this.

Solution:

Add this code to your project and have your view controller inherit from BaseViewController instead of UIViewController. Every time viewWillAppear is called, the simulator will force a low memory warning:

- (void)simulateMemoryWarning
{
#if TARGET_IPHONE_SIMULATOR
  #ifdef DEBUG
    CFNotificationCenterPostNotification(CFNotificationCenterGetDarwinNotifyCenter(), (CFStringRef)@"UISimulatedMemoryWarningNotification", NULL, NULL, true);
  #endif
#endif
}

Finding the Solution

I found myself in this pattern one too many times. I finally decided to find a solution.

The iOS Simulator has the menu Hardware -> Simulate Memory Warning

But I wasn’t going to select that menu item every time you test to see if something works.

I embarked on figuring out how this menu item works.

I looked through the UIKit framework binary (/Developer/Platforms/iPhoneSimulator.platform/Developer/SDKs/iPhoneSimulator4.3.sdk/System/Library/Frameworks/UIKit.framework/UIKit) searching for words like memory and warning.

I put breakpoints in gdb trying to find what message is sent. I read the NSNotification docs. After many dead ends I discovered the name of the notification: UISimulatedMemoryWarningNotification and that I needed to use CFNotificationCenter to send the message.

I’ve tried this out on a couple of projects and it has forced me to think about low memory situations from day one.

Full Source code: https://gist.github.com/956403

Tweet This!Hacker NewsShare on Facebook

Sometimes it’s useful to quickly see all the subviews of a UIView.

Perhaps you’re debugging a problem in one of your views or trying to understand the inner workings of one of the built in views.

You can simply iterate over a view’s subviews, but then you won’t see subviews deeper than one level. You need a method that recursively walks the hierarchy.

Luckily Apple has already done this with the recursiveDescription method, part of a UIDebugging category on UIView.

recursiveDescription was recently documented in a tech note titled iOS Debugging Magic.

At the gdb prompt in the Xcode debugger you can say:

(gdb) po [[self view] recursiveDescription]

and instantly see a description of the entire view hierarchy. We used this in our Transparent UIWebViews recipe to figure out the view hierarchy of a UIWebView:

(gdb) po [webView recursiveDescription]
<UIWebView: 0x68220e0; frame = (0 0; 320 460); >
| <UIScrollView: 0x4b2bee0; frame = (0 0; 320 460); >
|    | <UIImageView: 0x4b2dca0; frame = (0 0; 54 54); >
|    | <UIImageView: 0x4b2da20; frame = (0 0; 54 54); >
|    | <UIImageView: 0x4b2d9c0; frame = (0 0; 54 54); >
|    | <UIImageView: 0x4b12030; frame = (0 0; 54 54) >
|    | <UIImageView: 0x4b11fd0; frame = (-14.5 14.5; 30 1); >
|    | <UIImageView: 0x4b11f70; frame = (-14.5 14.5; 30 1); >
|    | <UIImageView: 0x4b11f10; frame = (0 0; 1 30); >
|    | <UIImageView: 0x4b11eb0; frame = (0 0; 1 30); >
|    | <UIImageView: 0x4b11e50; frame = (0 430; 320 30); >
|    | <UIImageView: 0x4b2d0c0; frame = (0 0; 320 30);  >
|    | <UIWebBrowserView: 0x6005800; frame = (0 0; 320 460); >

Tweet This!Hacker NewsShare on Facebook

To recreate features of existing apps, we can use a big clue: the images an app uses. This will often give us insight into how the feature was built.

You can right click on an App in iTunes and see the app’s .ipa file.

An .ipa file is just a zip file that is easily expanded resulting in a Payload folder that has the actual .app.

But we can’t just double click on the images and open them in something like Preview.app.

During app compilation Xcode optimizes all images so they aren’t readable by standard tools like Preview.app.

We need to undo the optimization and restore the images back to their original form.

The tool that the SDK uses to optimize the images is pngcrush and starting with the 3.2 SDK, Apple added the ‘revert-iphone-optimizations’ option to undo this optimization.

I wrote a quick ruby script called appcrush that automates this process.

Point appcrush at an .ipa file from the iTunes AppStore and it:

  • expands the zip file
  • finds all the images
  • runs pngcrush with the revert-iphone-optimizations option on each image
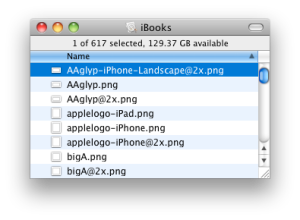
appcrush '/Users/boctor/Music/iTunes/Mobile Applications/iBooks.ipa'

You can find appcrush here: https://github.com/boctor/idev-recipes/tree/master/Utilities/appcrush

Tweet This!Hacker NewsShare on Facebook